Having a good grasp of your finances is important, but it is often hard to know what is the most important information to focus on. Xero has a great library of reports to use and have recently revamped their reporting module to make it more user friendly. We have selected our favourite reports to help business owners make more informed, real-time decisions with their Xero information.
1. Business Snapshot
The Business Snapshot (Business > Business Snapshot) provides a high-level view of every aspect of your business’s numbers. It includes a simplified version of the profit and loss and balance sheet and shows how your cash is moving in and out. Key metrics like GP and supplier/customer payment days are given alongside your cash balance. The report can be pulled for a month, quarter, previous financial year or financial year to date. We recommend using this for quick financial metrics that are beautifully displayed.
2. Profit and Loss: OLD vs NEW
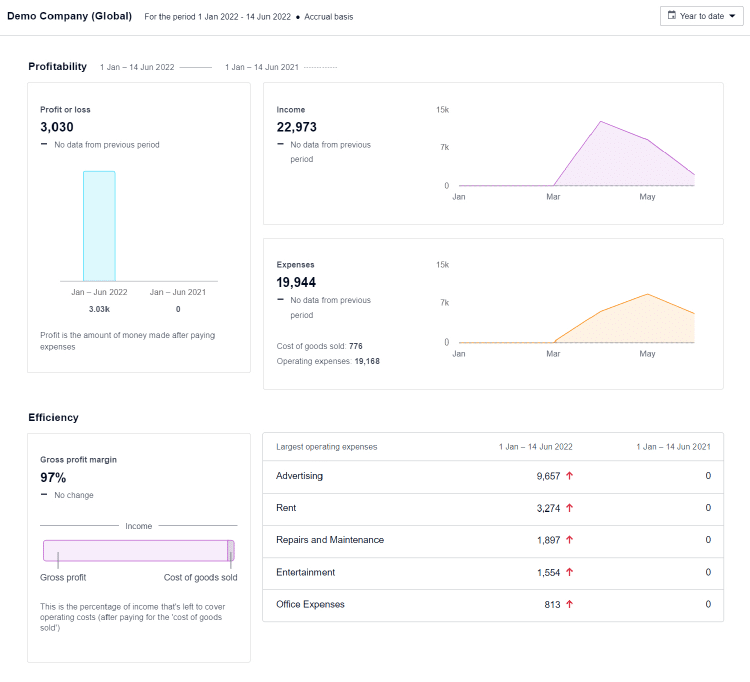
The Profit and Loss report provides a clear view of whether your business is making a profit each month. It is a great way to understand your monthly costs and any spikes or drops in costs during the year. If you sell products, your gross profit (GP) and GP margin are important figures to track and can be taken from this report. The OLD Xero report is able to be filtered for various date ranges and can also have a budget variance view. If you’re using tracking categories in Xero, you’re also able to view the Profit and Loss by tracking. This is particularly useful if you’re looking at divisions or locations and how they’re performing.

The OLD report allows you to perform limited edits to the report, but if you’re looking to build a more customized report, we’d highly recommend the NEW Profit and Loss report. Using this report, you’re able to do all the same things as the OLD report as well as group accounts together into sub-headings, summarise them, create formulas within your reports (eg: GP%) and move accounts into any order you like. Finally, you have the ability to build your own custom reports with set columns and save this report for later use.
3. Balance Sheet

The balance sheet is an overview at a point in time of your business’s assets, liabilities and your equity. Your assets and liabilities are split between current (< 1 year) and non-current (>1 year). Common ratios to consider when using this report are liquidity and solvency. The Liquidity Ratio is the ability for your business to repay your short-term debt using short-term assets (cash, receivables, stock). This is calculated by taking current assets/current liabilities. The Solvency takes a longer-term overview and is calculated by taking total assets/total liabilities.
When looking at the movements in the balances over time, it is important to take note of whether your business is building reserves, which can be seen from the growth in your equity balance or reducing reserves.
4. Aged Payables and Aged Receivables
5. Short-Term Cash Flow (Analytics vs Plus)
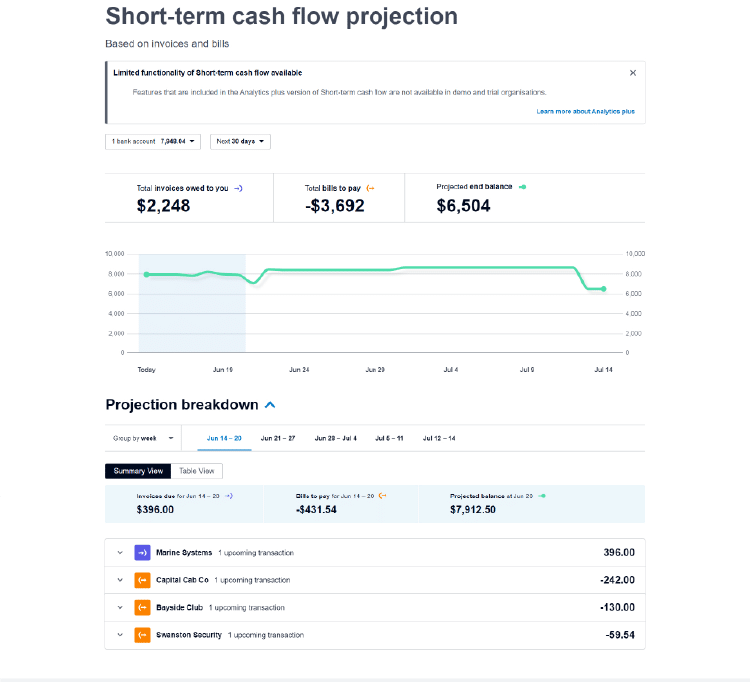
A useful tool to help predict your future cash flow and understand potential shortfalls on the horizon. The report predicts your cash flow based on expense and income due dates, which you can manually add or remove to see how this would affect your cash position. You can view a projection of your bank balance for 7 and 30 in the standard Xero Analytics package and, 60 and 90 days in the future by subscribing to the Xero Analytics Plus package. Analytics Plus is an additional $7 per month and includes AI cash flow modelling, longer-term forecasting, scenario planning and greater customisation of reporting.
Now that you have a better understanding of some of the key reports to use to manage your business, be sure to delve into each of them to get a better understand of your own business’s finances. Reach out to us if you have any questions on the above reports, how to better customise them for your business or how to interpret your figures.
